From Energy Monitoring to Action: Making Sustainable Automation Work in Real Plants
Sustainable automation becomes effective when energy monitoring systems turn plant-level data into actionable insights that improve efficiency, reduce peaks, and support net-zero goals.
An energy management system creates value only when metering, system architecture, site context, and analytics come together.
An energy management system is an important part of the sustainability journey, but it is not the entire net-zero solution, says Dr L R Rajagopal.
Net-zero and sustainability goals are now common across industry, but at the plant level the challenge is practical: how to use energy data to support real operational decisions.
Many plants have deployed energy monitoring systems to improve visibility. Yet a gap often remains between data and action. Total consumption is visible, but the drivers are unclear. Peak demand is recorded, but difficult to explain. Reports are generated, but not always used.
Drawing from field experience, this article looks at why that gap exists and how energy management systems can be made more useful in real plants.
Where energy management systems fit
An energy management system is an important part of the sustainability journey, but it is not the entire net-zero solution. Its primary role is in monitoring and managing electricity consumption. It can also include onsite generation and other utilities such as diesel generators, solar generation, water, steam, or gas.
In emissions-accounting terms, this makes energy management systems especially relevant to Scope 2 (purchased electricity), and in some cases parts of Scope 1 (direct fuel use or on-site emissions) where fuel or utility systems are monitored.
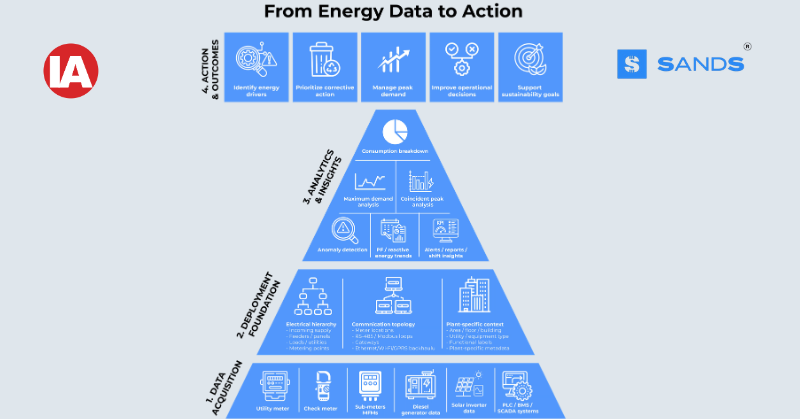
The value of energy monitoring lies not in total consumption alone, but in breaking usage down by area, process, or equipment; identifying the drivers behind peak demand and abnormal consumption; and translating those insights into plant-level action.

can shift the recorded peak, making coincident analysis, and sometimes a synchronised check meter necessary in practice.
Metering alone does not create insight
A main utility meter gives the overall picture – it shows total consumption, maximum demand, and the values used for billing. While this is important, it does not explain what is going on inside the plant. It does not show which feeder, process area, utility, or equipment group is driving consumption.
Sub-metering helps to fill this gap by breaking down energy use across the plant. Once meters are added at the feeder, area, utility, and/or equipment-group level, the internal picture becomes clearer. But sub-metering alone is still not enough. Many meters does not automatically mean better insight. The data still has to be mapped correctly to the plant’s electrical and operational structure.
What makes the system useful in practice
In practice, a useful energy management system depends on how well the deployment and data map generated during deployment reflect the plant. Three foundations are especially important.
The first is the electrical hierarchy: incoming supply, feeders, panels, loads, utilities, and metering points. The second is the communication topology: where the meters are located, how they are connected through RS-485 or Modbus loops, where gateways are placed, and how data is sent out through Ethernet, Wi-Fi, GPRS, or other networks. The third is plant-specific context: how each meter is mapped to an area, building, floor, utility, equipment type, or functional label.
Gathering this information is not a trivial task. But without it, the system may collect data without helping the plant understand what the data means. This is an area that is often underestimated: the software may be in place, but the underlying plant model is not always complete.
When field changes break software assumptions
Another practical challenge is that plant infrastructure does not remain static. Meters may be replaced, reconfigured, moved, or connected to different loads. If these changes are not reflected in the energy management system, the software may continue working with the old assumptions.
For example, if a multifunction meter is replaced with another make or model, the field technician may complete the electrical work correctly, but the software configuration may still point to the earlier device profile or parameter map. The technician may not even be aware that the monitoring system is affected by such information. In such a scenario, the system would continue the display values, but these values may no longer be reliable.
Why peak demand is harder to explain than it looks
Maximum demand analysis is where deployment details become very visible. Maximum demand is the highest average demand recorded by the utility meter over a defined period, commonly 15 or 30 minutes. If this crosses the plant’s sanctioned or contract demand limit, it can lead to penalties or higher charges.
The challenge is that the utility meter and plant sub-meters may not calculate demand in the same way. Sub-meters may log at a higher frequency, but their demand windows and clocks may not match the utility meter. As a result, the summed sub-meter demand often does not match the maximum demand recorded by the utility meter.
The bill may show a peak, while the internal system shows a different value or timestamp. To understand what caused the peak, the plant needs more than a simple sum of sub-meter values.
A practical approach to identifying peak drivers

Field experience shows that peak demand analysis often needs a more practical approach than simply adding sub-meter values and expecting them to match the utility meter. A better approach is to study the load pattern around the utility peak window.
Since sub-meters often log at higher granularity, their data can help identify which feeders, utilities, or equipment groups were active when the utility meter recorded the peak. This is the basis of coincident peak analysis. For example, a plant may find that peak demand is not caused by one large load, but by several loads overlapping: compressors starting together, HVAC or chiller loads ramping up, and production lines already operating. Once these contributors are identified, the plant can consider actions such as staggering loads, changing startup sequences, or investigating abnormal consumption.
A useful field workaround is to install a check meter or reference meter near the utility metering point and align its clock with the utility meter. This gives the plant a closer internal reference for the utility peak, while sub-meter data helps trace the contributing loads.
From monitoring to action
The peak-demand example points to a broader issue. Energy management is rarely just a software problem. It sits across electrical infrastructure, communication networks, utilities, operations, and management priorities.
In many plants, these areas are handled by different teams or vendors. Unless their views are brought together, the system may keep generating data without changing decisions.
Dashboards and reports are useful only if they change what the plant does. A useful energy management system should show what is driving consumption, where peaks are coming from, and which actions should be prioritised. This requires correct metering, a clear electrical and communication structure, plant-specific context, and practical analysis.
As plants move toward greater energy awareness, onsite generation, and flexible operation, this foundation will become even more important.
Dr L R Rajagopal is the Founder and CEO of SANDS (https://www.sandsindia.com/), an Indian technology company that develops products and solutions for energy metering, power quality, time synchronisation, and industrial monitoring. With advanced degrees in Electrical Engineering, specialising in Digital Signal Processing, from the Indian Institute of Technology (IIT), New Delhi, he has decades of experience in engineering and product development. He has worked across industrial electronics, digital systems, communication protocols, and technology solutions for critical infrastructure. He has also contributed to standards-related initiatives in India in the areas of electronic metering and communication protocols.